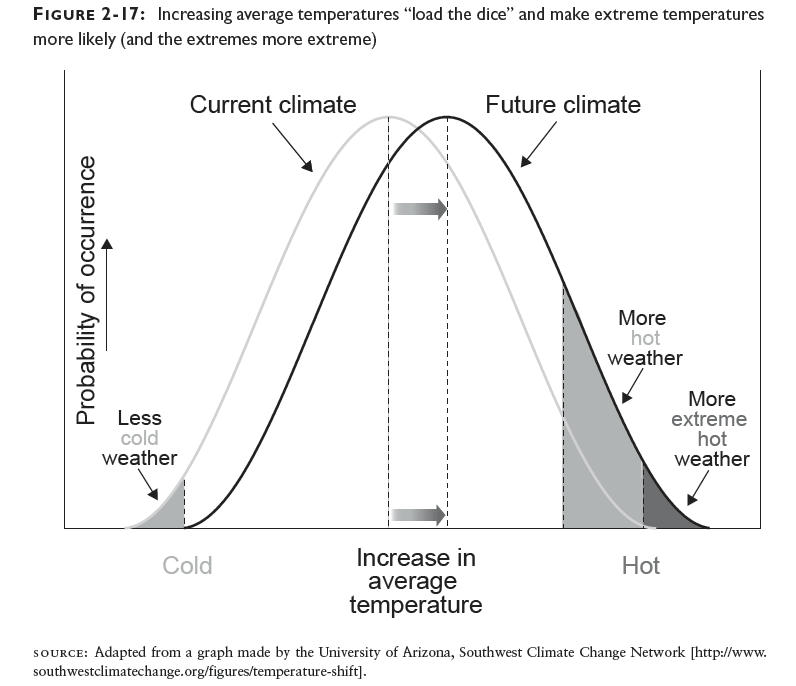
Jim Hansen just published a terrific summary of the past few decades of temperature measurements, and it shows the stark reality: increasing the average temperature even a modest amount substantially increases the chances of extreme temperature events.I showed this result conceptually in Figure 2-17 of Cold Cash, Cool Climate using a graph from the University of Arizona’s Southwest Climate Change Network:
Now, Hansen has calculated the actual distributions by decade to show what’s really been happening, and the results are striking. The overall summary is in his Figure 2:
Figure 2. Temperature anomaly distribution: The frequency of occurrence (vertical axis) of local temperature anomalies (relative to 1951-1980 mean) in units of local standard deviation (horizontal axis). Area under each curve is unity. Image credit: NASA/GISS.
JK note added Aug. 14, 2012: the horizontal axis is NOT in units of temperature but in terms of standard deviations from the mean. For a normal distribution, which these graphs appear to be, about 68% of all the occurrences would be found within one standard deviation from the mean, and 95% of them would be within two standard deviations. When I figure out how to convert these results to temperature I’ll post again. More